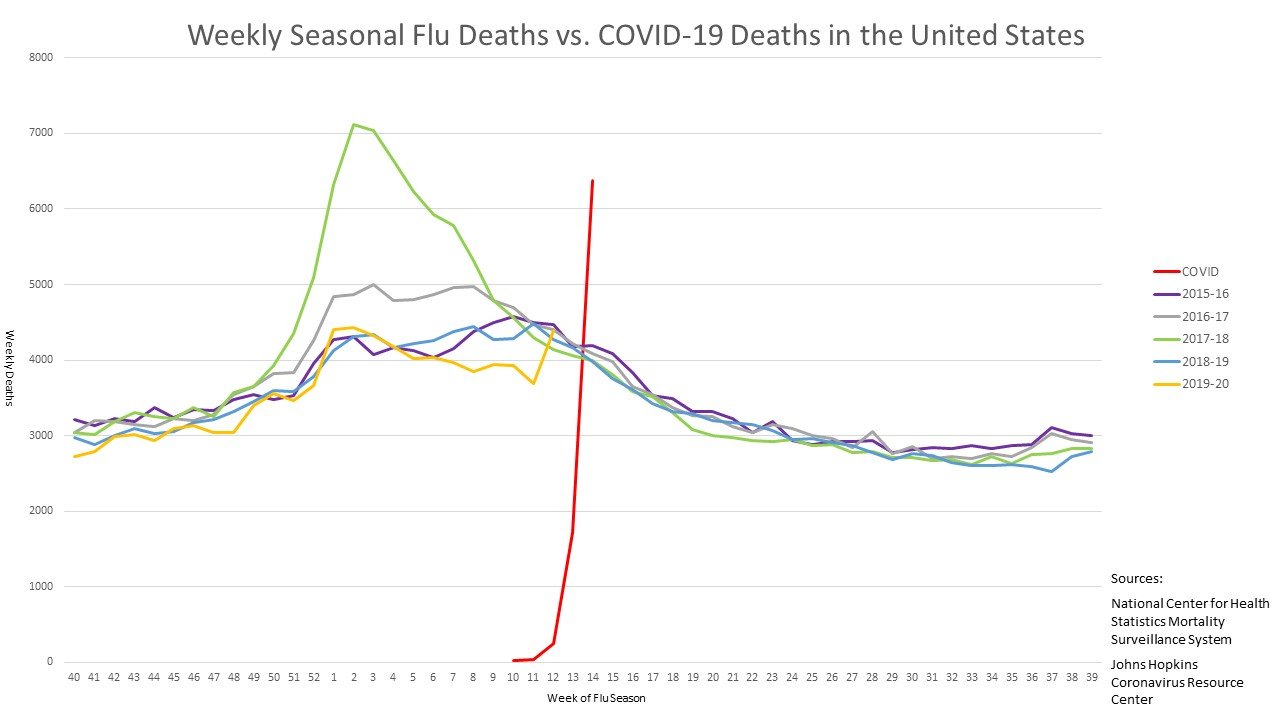
The first thing to notice is that COVID started out in the middle of "flu season" - roughly October through May in the US. The reason is obvious: COVID is a foreign import that didn't land in the US--according to current CDC thinking--until January 15, 2020. However, once the virus established a base of infected persons, 15% of whom will get seriously ill, it took of like a rocket--the trajectory of the "curve" is almost straight up. Flatten THAT curve! Well, that's why the lockdown.
The next thing to notice is the 2017-2018 flu season. The 2009 season doesn't show up on this graph, but 2017-2018 was the worst since then, resulting in 61K deaths by CDC reckoning. By comparison, 2017-2018 appears to have been much more severe.
You can see that the trajectory of the 2017-2018 season is markedly different from the other seasons and, while not as extreme as the COVID trajectory, is plenty extreme. However, it also declined very sharply and, essentially rejoined the standard flu season trajectory.
A very interesting Wikipedia article explains what was going on in that season:
According to the director of the Center for Disease Control and Prevention's influenza branch in January 2018, it was the first flu season where "we've had the entire continental US" show the same "widespread" flu activity, excluding the District of Columbia and Hawaii. Twenty-six of those states were classified by the CDC as having "high" activity in January 2018.
In January 2018, analyzing the reason for the spike, The Atlantic noted that the flu season was possibly worse because the dominant circulating strain was the H3N2 strain, which for unknown reasons tends to hit humans harder than other strains and result in worse flu seasons when dominant. Also, the H3N2 strain, according to the CDC, affects elderly and young children more than other strains, resulting in more severe hospitalizations and deaths.
The Atlantic also noted that the 2017 vaccine for the flu was only ten percent effective against H3N2 in Australia. As the typical practice of studying and creating the current vaccines in chicken eggs tends to result in mutations, 2017 was the first year that researchers used dog cells rather than chicken eggs to create the H3N2 component of the vaccine Flucelvax. However, due to cost, most Americans did not get Flucelvax in 2017 and 2018 and likely received vaccines grown with chicken eggs. The Atlantic noted that the vaccine still protected against other strains such as the H1N1 and B virus, and did provide at least some immunity to H3N2.
Note that this particularly hard hitting flu virus was loosed on a largely unimmunized (by vaccine) population. Nevertheless, there was some degree of immunization both from the vaccine and from exposure to other strains of the flu. Nevertheless, as the graph shows, this was a very bad season and well outside the norm. We would not want to regularly repeat that experience.
By way of comparison, however, in the case of COVID there is NO degree of immunity in the population subjected to the SARS-CoV-2 virus. That is the reason for the alarm on the part of public health officials: The SARS coronavirus is known to be deadly, and the 2019 version--whatever its origins--while not as deadly as SARS-Classic--spreads far more readily. As we've seen. The fear was that if this more contagious form of SARS were to spread widely it would kill far more people even with a lower case fatality rate--just because so many more people would have been infected.
Why weren't we better prepared? The graph, in a sense, explains that, too. H3N2 flu is hard on humans. However, there are even deadlier forms of the flu out in the wild, so to speak, that haven't made the full jump to human-to-human transmission. That's the "big one" that epidemiologists fear, and for which they were trying to prepare a vaccine. That's what they had their eyes on, and they lost track of SARS in their anxiety of a new and even deadlier strain of flu making the mutation jump to human-to-human transmission.
Meanwhile, the Chinese were fooling around with the SARS virus in their lab in Wuhan. Another factor the epidemiologists apparently didn't take seriously enough.
It is different because it is a bioweapon created by the commies and intentionally released into the west. The virus was infected into people and they were sent all over the world. Sort of like living time bombs. Unfortunately for the dirty commies an accidental release spoiled the attack.
ReplyDeleteRob S
Rob S,
DeleteDid you mean to say that the commies intentionally released it into the west or that they intend to release it? I ask because your last sentence says an accidental release spoiled the attack. Please clarify.
Unless there is anything concrete or the circumstantial evidence is soo overwhelming, I will not attribute to China this, but I will not totally discount it either.
DeleteDid you yourself make that graph?
ReplyDeleteOr did you copy if from someone else? If so, then you should provide a link.
Actually, if you right click on the graphic and select 'Copy link address' you'll get what you want. Also, the bottom right corner provides the sources of the data.
DeleteHowever I will add this:
https://twitter.com/balajis/status/1247480598194573312